Dashboards: discover their benefits for business management
In your workplace, have you ever heard the term «dashboards»? The English word may seem daunting, but this type of tool has been increasingly applied in the corporate environment and has become a trend in business organisations.
The integration of new technologies for data analysis in the corporate environment has become increasingly common. Companies, which depend on their results, seek to analyse every aspect of the business meticulously in order to make more informed decisions.
For this reason, comprehensive and easy-to-understand reports need to be brought into consideration.
However, the visualisation of this data has become extremely easy and dynamic following the popularisation of this tool, which exists precisely to make these analyses more visual.
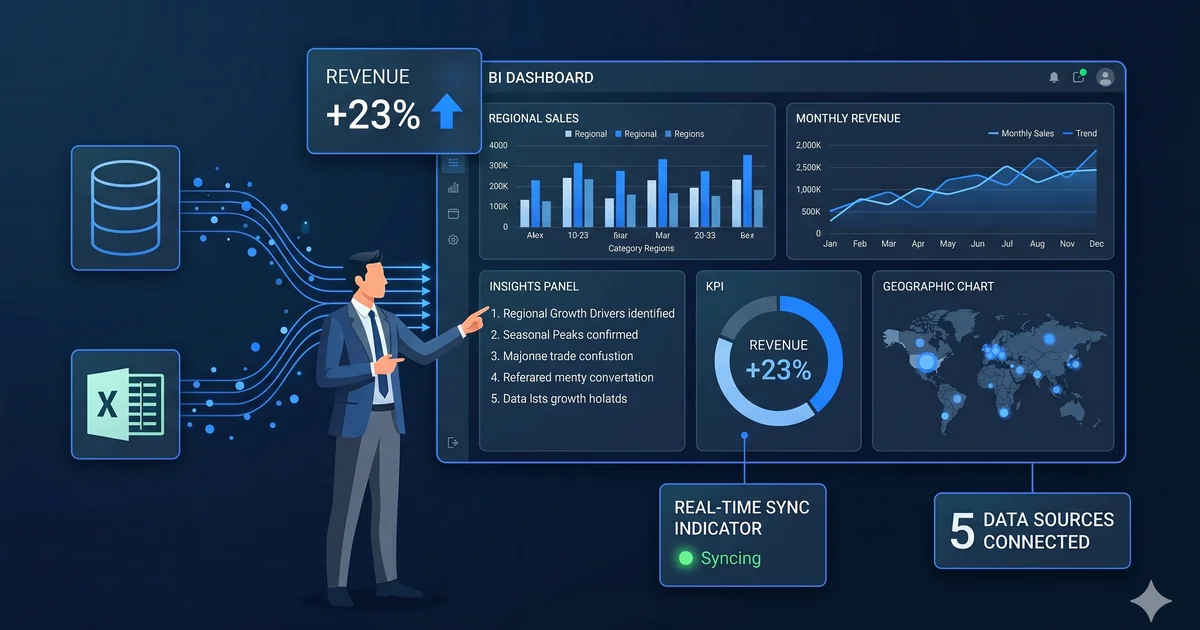
A dashboard is a reporting model that presents data and information in a clear and objective way.
These resources are increasingly used in business management, as they offer many benefits for monitoring indicators, making decisions, and improving processes.
One of the advantages of this tool is accessibility to important information, without the need to waste time searching for data scattered across complex reports.
In addition, dashboards present information simply, making it easier to understand and interpret.
Examples of dashboard use
If a property consultancy firm wants a report on a particular residential development, which do you think is more efficient, having that paperwork to hand, or having a macro overview with specific details via a dashboard?
Better than having the information is having complete, detailed data with zero complexity. And that is precisely what this tool provides.
Dashboards also help identify trends and patterns in data, enabling the tracking of important indicators such as sales, production, and customer satisfaction, among others. This makes decision-making based on highly reliable data possible.
If a company, for example, stops conducting these analyses, its competitors that use dashboards are likely to have far more accurate data and achieve more satisfactory results.
Another major advantage is customised data analysis, it is possible to create specific reports for each area of the company, tailored to the needs of each department. This gives everyone access to the information most relevant to their work.
You can use dashboards in virtually any area of your company that deals with data and requires faster, more efficient analysis. Some common departments include:
- Finance;
- Marketing;
- Sales;
- Customer support;
- Human resources.
These are just some of the countless areas where dashboards can be used. The key is to identify the metrics and indicators that matter most to your company and present them in a clear, easy-to-understand format.
A company can extract reports from all of these listed departments and can also take information from one segment and compare it with another, without significant difficulty.
The most important thing is that all the key stages of the company's growth are covered within this scope. To achieve this, those responsible must conduct adequate research to extract the right data over the timeframe they deem necessary.
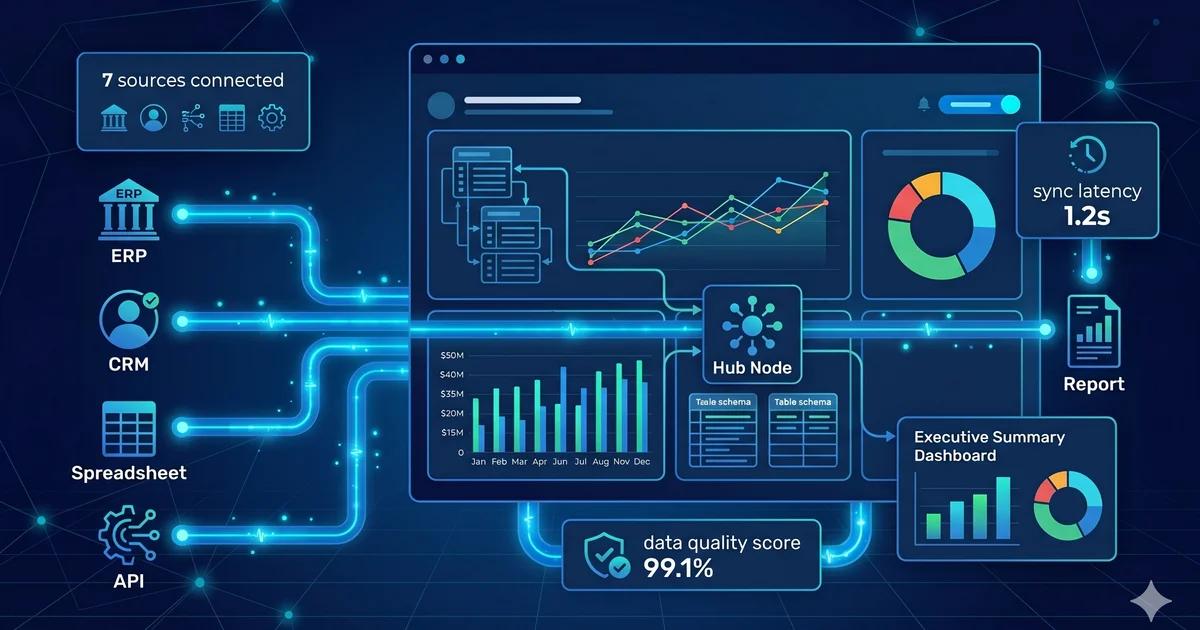
Integration with other tools, such as management systems, databases, and applications, is also possible. This enables the automatic collection of information, ensuring that the data displayed on the dashboard is constantly updated.
Furthermore, dashboards also enable collaboration between teams and departments, as information is shared in real time and can be accessed by any authorised person.
This increases transparency and management efficiency, as everyone has access to the same information and can work in a more coordinated manner.
Business management and dashboard benefits
The use of dashboards in business management is fundamental to effective decision-making. They allow managers to monitor the evolution of financial, sales, production, and customer satisfaction indicators, among others.
In addition, dashboards allow trends and opportunities to be identified, which is fundamental to business success.
Another advantage of dashboards is their customisation capability. Companies can create dashboards specific to each area or department, according to their needs.
This makes it possible to obtain relevant, up-to-date information on company performance, helping to make strategic decisions.
If a printing company needs to restock its raw materials, it can extract a customised report containing only the suppliers with which it has had commercial relations over the last two years, for example.
Personalised segmentation maximises possibilities. In addition, dashboards also enable collaboration between departments. They allow teams to share information and work together to achieve company objectives.
This increases efficiency and productivity, as teams can act quickly to correct any problems that arise.
The use of this type of report is fundamental to effective company management, as it provides valuable information for making informed decisions. The benefits of using dashboards for this type of overview are numerous.
Good data analysis enables management to make informed decisions based on insights into company performance, market trends, and related factors.
The ideal approach is to test data-crossing possibilities to arrive at the most visual and comprehensible result possible.
In practice, extracting data directly from a dashboard to assess which approach delivers the best financial return for the company means the final decision is the most beneficial one for the business.
Therefore, the broad view provided by this comparison allows the final decision to be the most advantageous for the business.
Another interesting factor for the corporate environment is that data analysis helps identify areas for improvement in the company's processes, which can lead to better performance and increased efficiency.
In other words, it is possible to upgrade the company's operations in order to generate even greater results from this approach.
A company can very well use the reports to optimise its processes, knowing what works best or least effectively in its internal methodology.
Data monitoring, carried out using a dashboard, allows the company's performance to be tracked against established goals and objectives. This is important for identifying strengths and weaknesses and taking corrective action.
If a distributor extracts periodic reports with analyses of its business weaknesses and opportunities, the probability of that company anticipating a potential crisis is high.
After all, one of the key strengths of the dashboard is the ability to deliver comprehensive reports that speed up decision-making.
Data analysis enables immediate access to information, allowing decisions to be made more quickly and the company to respond to market changes.
What is the difference between a dashboard and a conventional report?
Dashboards, like any other type of report, serve to present relevant data and indicators.
However, although all models are important for management, dashboards offer more significant advantages when it comes to saving time.
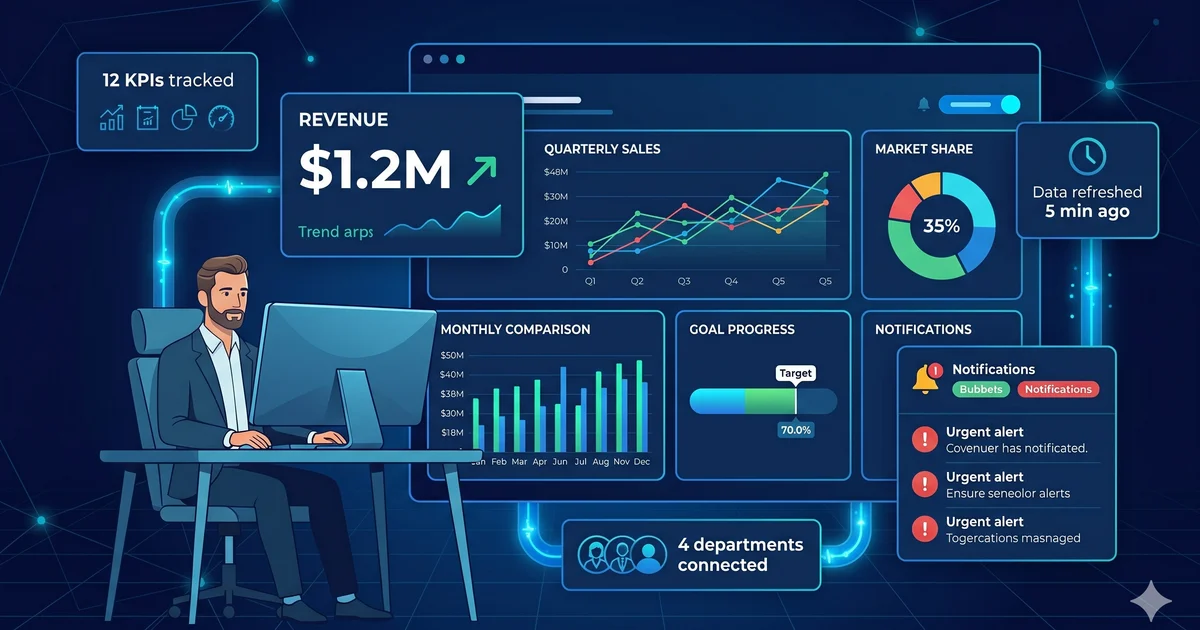
Compared with traditional reports, such as sales, financial, and production reports, dashboards are more visual and interactive.
As a result, they present charts, tables, and other types of data in real time, allowing managers to visualise performance across different scenarios.
A company working exclusively with metal roofing owns only its specific equipment as its own assets.
Using data extracted from a dashboard, the manager realised it is far more advantageous to purchase other specific equipment rather than renting it, in order to save money.
In this previous example, the manager's analytical perspective combined with the comprehensive overview provided by the dashboard made a financial breakthrough possible for the company. And that is just one of the many ways in which this model can prove beneficial.
Furthermore, dashboards are easy to use and do not require technical knowledge to operate. They have an intuitive interface and interactive charts, allowing managers to explore information and identify trends and patterns with ease.
In the end, the most useful tool will always be the one that can prevent problems and setbacks. And precisely because it is a tool with more comprehensive outputs, the dashboard has the edge over other reporting models.

Product with proven ROI in real data
Sthealth reduced billing errors from 15% to 4% in 60 days. See how strategic data transforms operations.
View case studies