Management Dashboard: Learn How to Optimise Your Results
Managing a company is often a challenging task, given the many fronts of analysis and decision-making involved, which can prevent the professionals responsible from actually achieving their objectives.
However, through technological innovations such as management dashboards, it is possible to view companies in a 360° mode, understanding everything in an integrated way.
This tool is very common in large companies, such as corporations that need powerful internal visibility across different departments in order to make well-grounded decisions.
Furthermore, it is a way of better organising metrics and results, which facilitates their presentation in meetings, something that is not always practical and does not always fulfil the functions requested by business owners.
Below, we will learn more about the management dashboard, how it works through common practical examples, and all of its benefits in general terms.
What is a management dashboard?
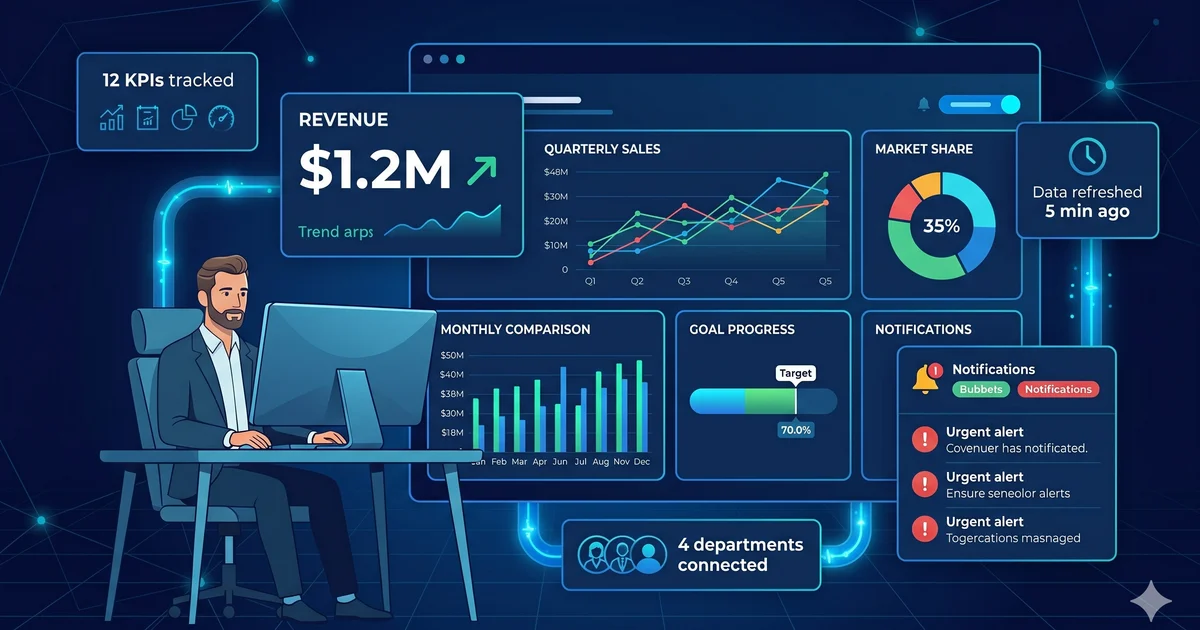
A management dashboard can be understood as a computer system that unifies different areas of a company or a department, presenting data that enables better verification and organisation of information to be understood internally.
In simpler terms, a dashboard is essentially a broad and powerful overview of everything that matters within an organisation.
To better understand its purpose, consider the daily work within a company that, for example, serves numerous clients across a city.
Often, departments that deal with payments, for example, have greater difficulty centralising client information and even identifying issues that may be harming the company, such as financial losses.
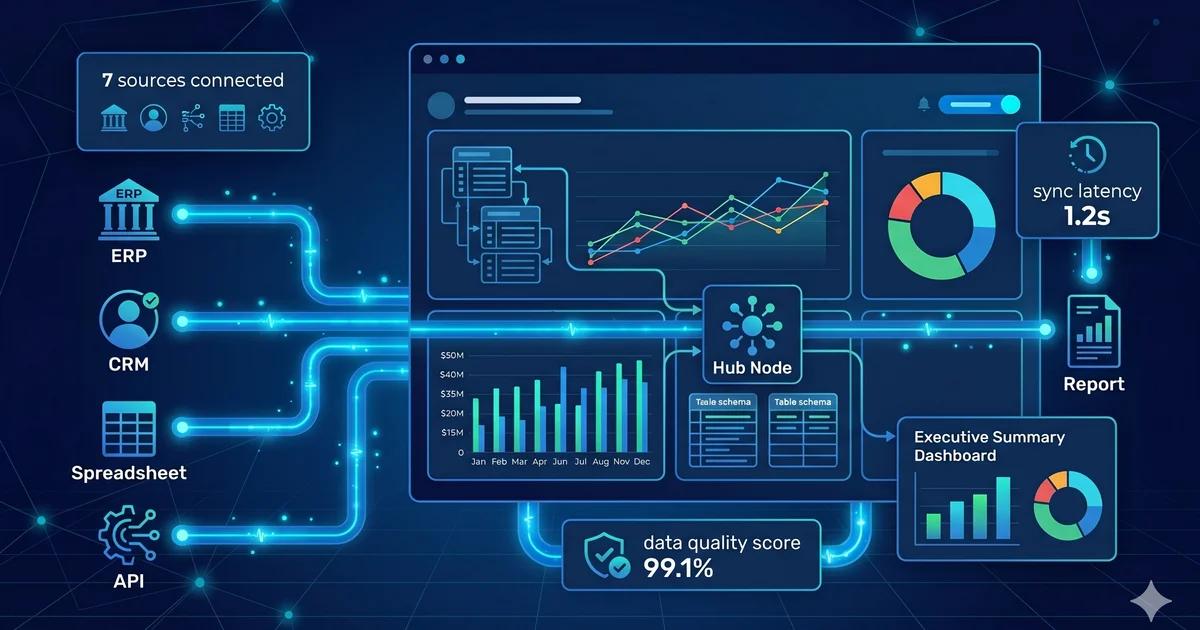
In this way, through its own management dashboard, a business can bring all client information together on a single screen, including:
- Contracts;
- Payments;
- Working hours;
- Field professionals;
- And more.
That is, it is possible to have a general overview of the service provided by the company to its clients in one single platform, seeing information that enables a better service within the department, in this case, focused on payments, outstanding client balances, and accounts payable.
This is an interesting solution for companies working with multiple clients, since all of them can be displayed in a single view with all their characteristics.
But beyond that, this overall understanding and reading of the entire corporation can deliver better results, as decision-makers across departments and throughout the company can access more concrete data.
Within a business, there are many analyses that can be carried out and that produce results which must be turned into actions, whether corrective, problem-solving, or relating to investments in personnel or materials.
The reality is that in the work of results analysis and incorporation of actions, the essential thing is to have a concrete view of the entire company, so as to provide a solid foundation for good internal decisions.
Otherwise, without full use of a management system, it would be practically impossible to both visualise and understand what needs to be done within a company to achieve a better decision-making structure.
Types of dashboards used in companies
Now that we understand more precisely what a management dashboard is and what its main function within organisations is, it is worth knowing that it can be incorporated into multiple departments, operating in specific ways within each context.
Below we have gathered some examples that demonstrate how a management dashboard works and what it can offer in terms of quality visualisation. Take a look:
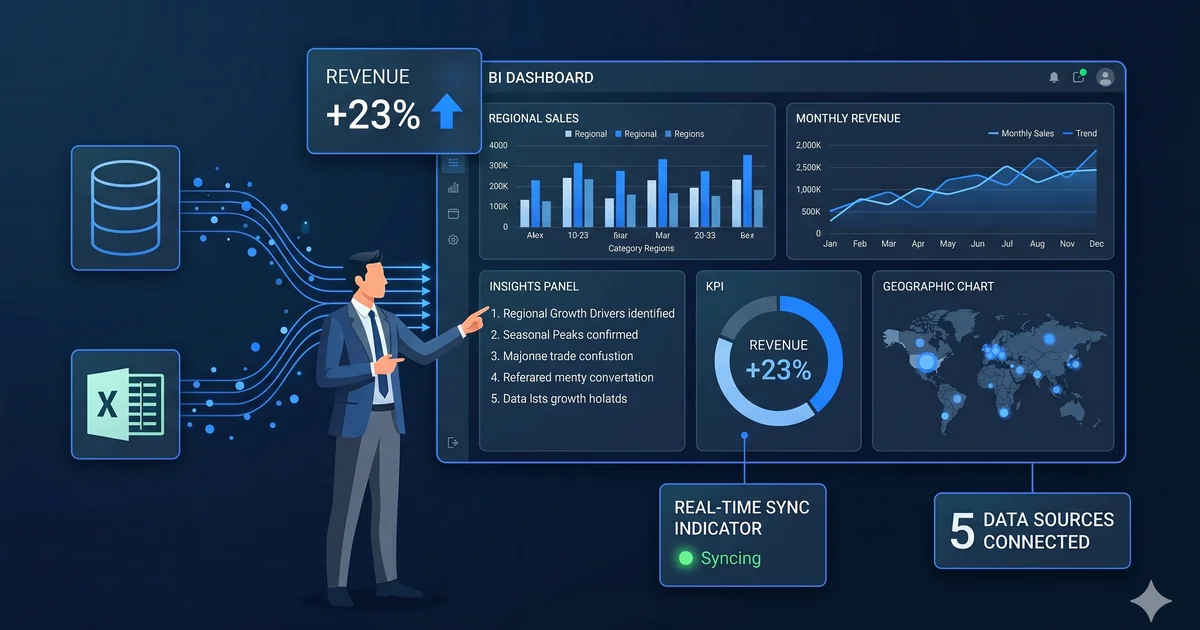
Dashboard in the finance department
The finance department is one of the areas that most needs adequate data visualisation, since it is within this context that decisions are projected to help the company deal with its needs, such as cash flow shortfalls.
It is therefore essential that people working in this area have access to centralised information, covering accounts payable, staff salaries, incoming client payments, supplier contracts, and more.
A management dashboard in this department can present all this information through charts in an easy and practical way, proposing a clearer overview.
Dashboard in Human Resources
In a company's human resources department, for example, it is quite common for there to be concerns about staff recruitment, payment of taxes, duties, and other internal legal compliance requirements.
In this way, a management dashboard greatly facilitates understanding of what is underperforming within the employees' services.
Furthermore, decision-makers in the company regarding the hiring of new staff can focus more on bringing solutions and creative ideas to address staff turnover and select people aligned with the company's values.
Dashboard in educational management
Within a school, university, or any other type of institution, managers must address both administrative matters, such as procurement, and educational issues involving students and teachers.
Through a management system, the educational dashboard can show those responsible for decision-making information such as grades, student and teacher absences, tuition payments, exam results, and more.
This makes it easier to understand how the institution's results are progressing, and to then propose specific improvements in monthly or weekly meetings.
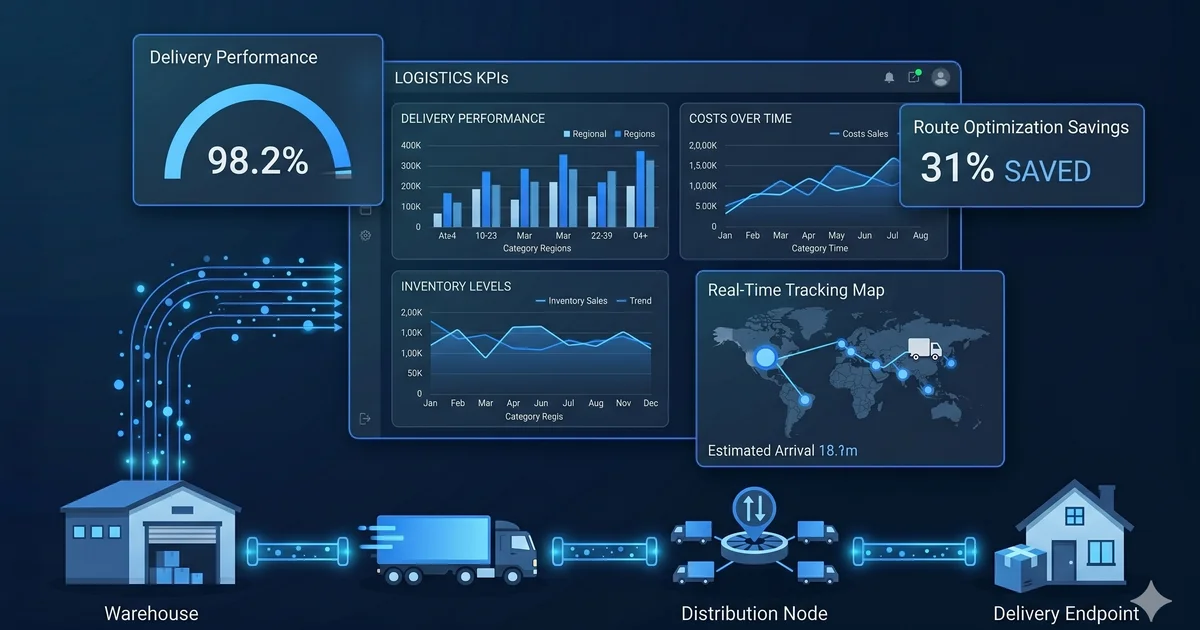
Dashboard in the warehouse
A company's warehouse, or that of any other operating area, has a fundamental relationship with production, sales, and investments made by the company, while also identifying ideas that can capitalise on internal challenges.
One example is a company that can propose promotions to move products from stock, understanding that this helps manage production turnover.
In the management dashboard of this department, it is quite possible to find a complete overview of everything that belongs to the company, real demands, those that can be fulfilled, and other forms of understanding the products and services that should be comprehensive.
What are the benefits of using these tools?
So far, we have been able to learn more about management dashboards, their use in some work formats and specific contexts such as schools and financial environments, understanding how powerful a tool they can truly be.
But why are they so important in these settings? Is it purely about organisation? In fact, the organisation and visualisation of results and data within a corporation represent the future of the analysis of actions and decisions that must be put into practice.
Often in strategy alignment meetings, for example, people who present results and want to propose improvements face greater difficulty, something that can be resolved with the visualisation approach provided by the dashboard.
However, the possibilities for gains and the benefits in general are much greater, with a more concise decision-making process being the ultimate foundation of this investment.
An administrator's work often demands this high capacity for analysis and choice, and through a well-structured dashboard that clearly shows what is right or wrong, the search for solutions and the selection of actions becomes more practical.
In addition, when compared to other types of investments, a management dashboard can deliver far greater value, even resulting in cost reduction.
A good example of this is the productivity dashboard within a clothing company, which may not call for more staff recruitment but rather for a better distribution across shifts, delivering more efficient results and prompting a smarter choice.
Final considerations
Overall, having a dashboard that unifies data and collects information efficiently can add greater knowledge to companies about what is happening inside them, showing managers the best paths based on solid evidence.
Therefore, obtaining this tool can be more than just a means of organisation, it is a long-term investment within the company, which ends up unlocking solutions that had never been imagined before this system existed.

Product with proven ROI in real data
Sthealth reduced billing errors from 15% to 4% in 60 days. See how strategic data transforms operations.
View case studies